When does discount retailer Action need a Romanian warehouse?
By Lovis Anderson, previously product owner for supply chain network design software at OPTANO, a Kearney company.
Action is Europe's fastest-growing discounter: roughly 3,300 stores, 19 distribution centres, three new DCs a year. In September 2025 it entered Romania. As of early August 2026 its own store finder lists 22 Romanian stores (around 18 of them open, the rest announced openings). Its published DC list shows the nearest warehouses are in Bieruń (Poland) and Bratislava (Slovakia), 600 to 1,300 road kilometres away from those stores.
That's the setup for a classic question in supply chain design: keep serving a new market from the existing network or open a local DC, and when does the switch pay off?
We rebuilt the decision with public data and ran it as a real network design study in SCMotif. Only later did we find out that Action had already answered it. In September 2025, three weeks before the first Romanian store opened, developer WDP announced a 54,000 m² DC for Action near Bucharest, operational around 2027. The model was built without knowing this, so it isn't fitted to their answer.
The short answer: break-even sits in the mid-50s, one to two years out at Action's current pace; next-day service pushes the case harder than cost does; and the site should follow the projected footprint, which points to the Ploiești / Bucharest-West corridor.
What the public record gives you
- All 22 store locations, from Action's own store finder. The surprise: the footprint is not Bucharest-centric. It's western-Romania-heavy (Oradea, Arad, Satu Mare, Hunedoara) plus a corridor through Ploiești and Pitești. Exactly what you'd build if your trucks came from Poland and Slovakia.
- The real serving candidates: Action's DC list names Bieruń and Bratislava. No Czech DC exists.
- Road distances from open routing data (OSRM), on real roads rather than straight lines.
- Store economics from Action's published revenue (~€4.7M per store per year), which pins per-store volume at roughly 26–34 pallets a week.
What remains estimated is documented with sensitivity ranges: FTL rates (domestic Romanian vs international, plus corridor truck tolls), warehouse fixed costs from Romanian logistics real estate benchmarks, an inbound penalty for feeding a new eastern DC from Action's centrally consolidated import flow, and an inventory carrying rate for the stock a second serving point adds.
The experiment
Each store-growth cohort (today's 22 stores → 150) solved as a cost-minimizing flow optimization, for two network configurations:
- Baseline: keep serving from Bieruń + Bratislava.
- A new Romanian DC at Bucharest-West, Ploiești, or Sibiu (the existing DCs stay available; the optimizer decides per store which site actually wins).
Plus service-level runs (what if every store must be reachable within a one-day driving radius?), a Budapest compromise hub that wins on neither cost nor service (details in the assumptions log), and a demand-weighted center of gravity siting per cohort.
Finding 1: break-even at ~56 stores
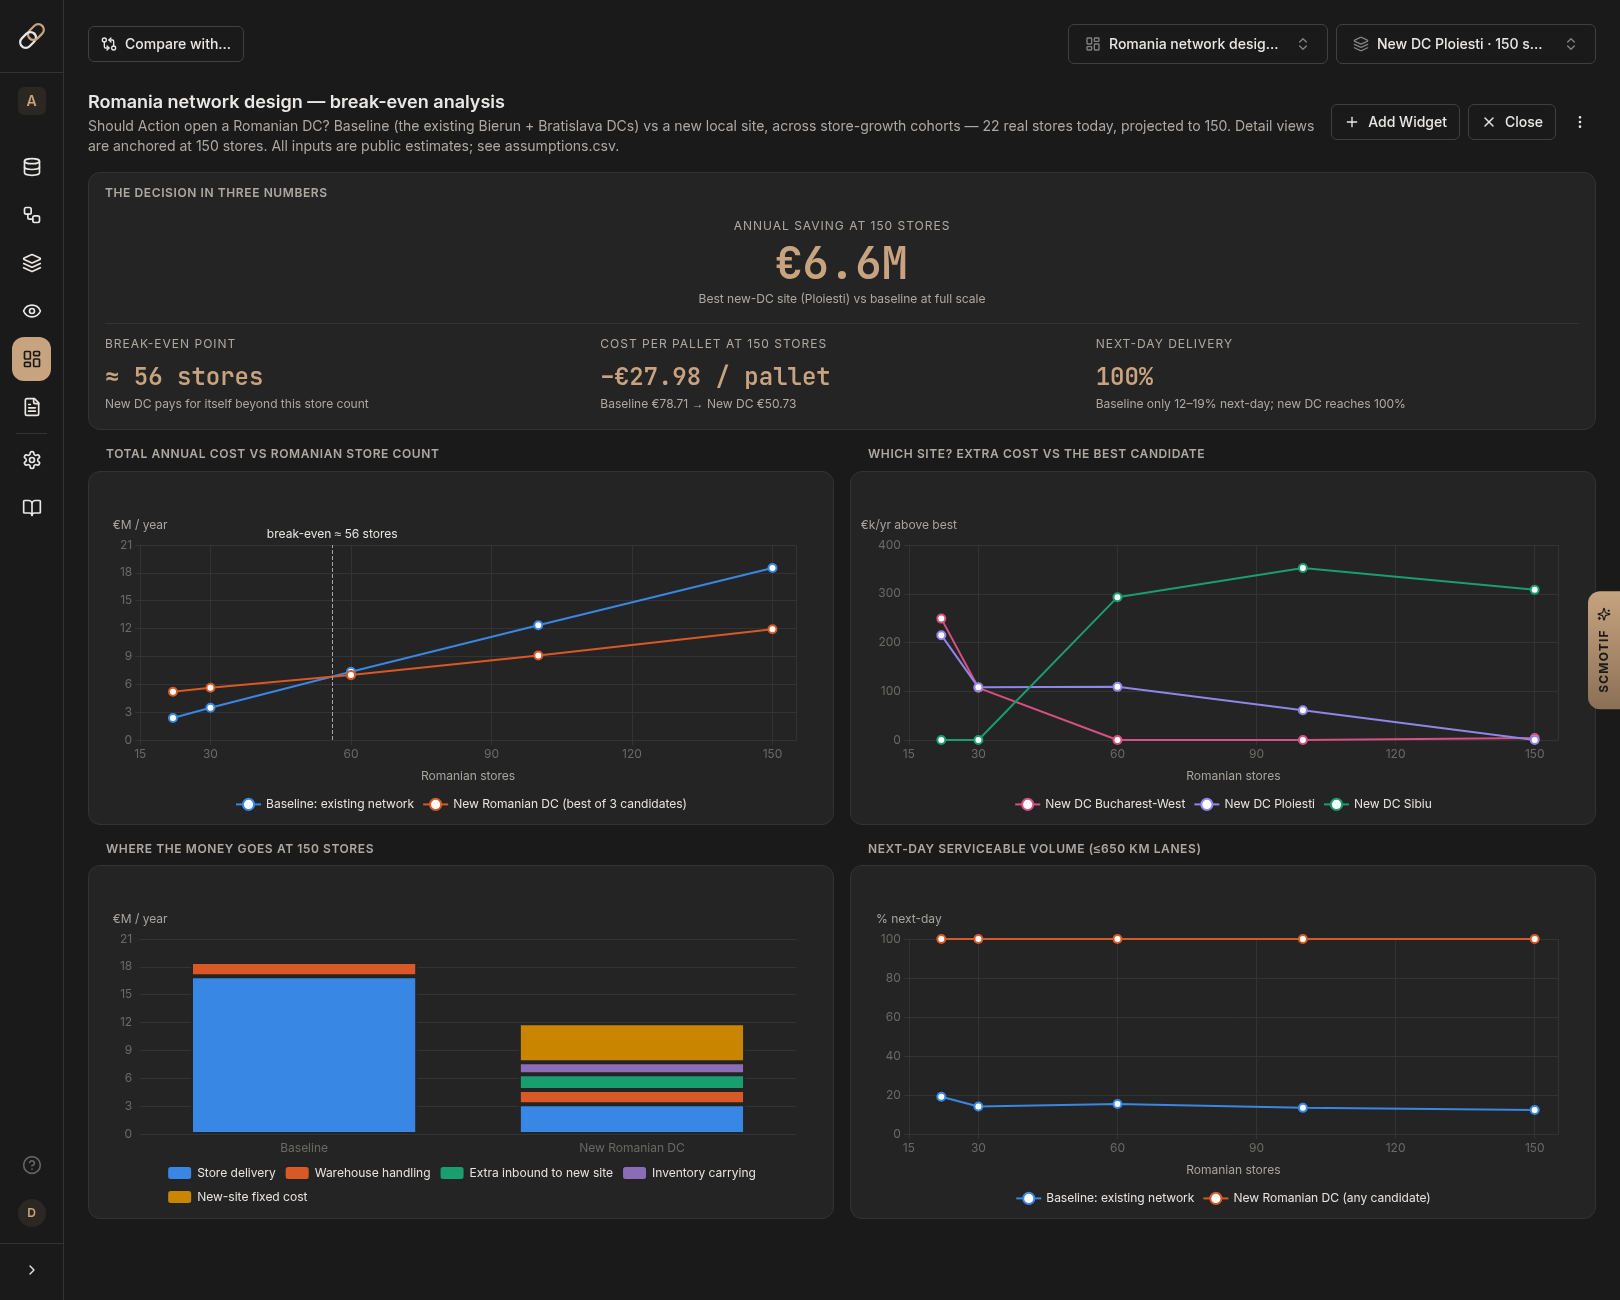
Below ~30 stores, the existing network wins: a Romanian DC's fixed cost (~€4.2M/yr) buys nothing that 1,000 km of trucking doesn't already do cheaper. Break-even lands at ≈56 stores. At 150 stores, the local DC saves ~€6.6M every year. Every added Bucharest-area store widens the gap.
The answer is robust to the estimates. Demand ±20% moves break-even to ~47–70 stores, with the ramp-up downside as the honest headline range of 55–70 stores. Fixed cost ±€1M/yr moves it by ~10–15 stores, the inbound and inventory adders by ~5–10 each at ±€4/pallet, and pricing transport with a flat rate instead of the corridor texture moves it to ~72. Every tested lever leaves the crossing between the mid-40s and the low 70s. At Action's expansion pace that window is at most a few years out, and a DC takes 12–18 months from decision to go-live. The countdown has already started. And no cost lever touches Finding 2: nothing makes 1,000 km next-day.
The extra inventory a second serving point carries is priced in, at €6 per pallet through the new DC (derivation on the assumptions page). One known bias remains: the DC is priced at full size from day one, which moves break-even later than a right-sized build would.
Finding 2: the service argument is sharper than the cost one
Apply a next-day service requirement (a ~650 km drivers'-hours radius) and the question changes: 18 of today's 22 stores are already beyond next-day reach of every existing DC. Only ~19% of volume is next-day-serviceable from the current network, falling to 12% at 150 stores. The Budapest hub fails the same test for eastern Romania. Every Romanian candidate site serves 100% of volume next-day, at zero cost premium. The zero is structural: with a local DC open there is always a cheaper lane under 650 km, so the cost-optimal solution already runs every pallet next-day, including the ~9% that stays with Bieruń and Bratislava serving stores inside their own radius. The next-day constraint never binds.
For a promo-driven discounter, replenishment lead time is arguably the primary driver, ahead of the transport bill. Under a service constraint, the baseline becomes infeasible. Cost is no longer the question.
Finding 3: the best site flips as the network grows
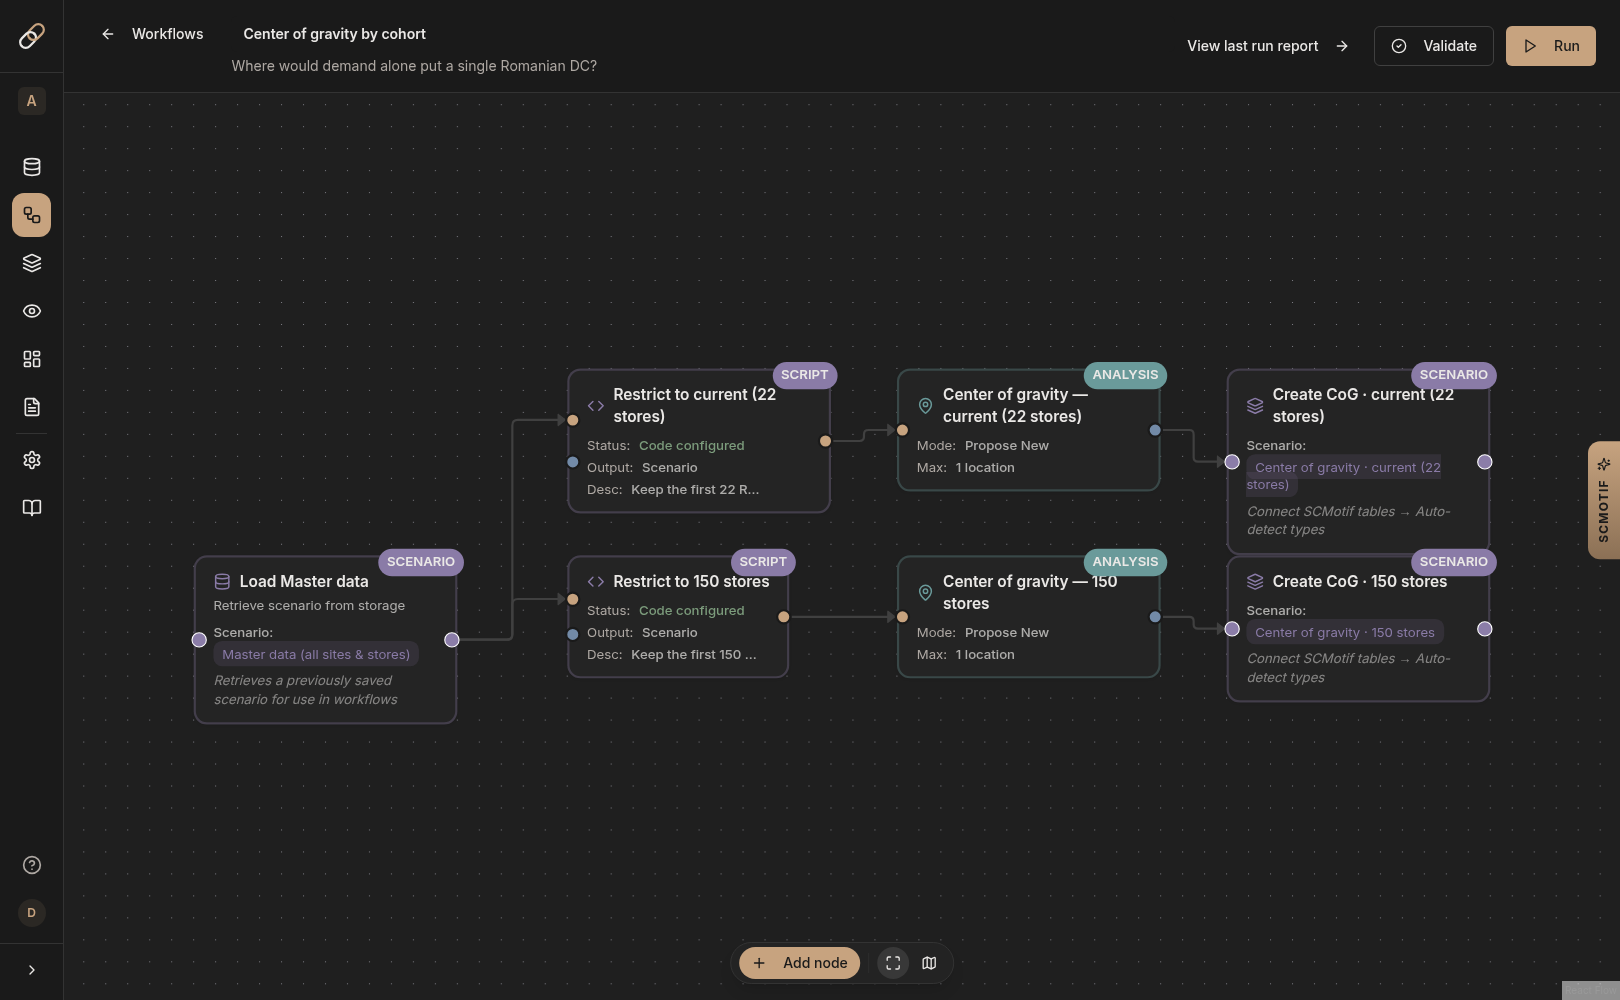
At today's west-heavy footprint, Sibiu is the cheapest candidate, and the unconstrained center of gravity calculation lands almost exactly on it. But as growth fills in Bucharest and the south-east, the optimum drifts: from ~60 stores onward, Bucharest-West / Ploiești win, and the center of gravity migrates the same direction. Site selection should follow the projected footprint rather than today's map. A warehouse sited on the current store list would be the wrong warehouse in three years.
Action's announced site fits this picture. Ștefănești sits on Bucharest's north-eastern ring. That is the side of the country the model favours as the growing footprint approaches Romania's actual population distribution.
(The center of gravity serves as a crow-flies sanity check. At 150 stores it lands in the Carpathians. The site decision comes from costing real candidate locations against each other, over real road distances.)
Finding 4: the optimizer splits the network
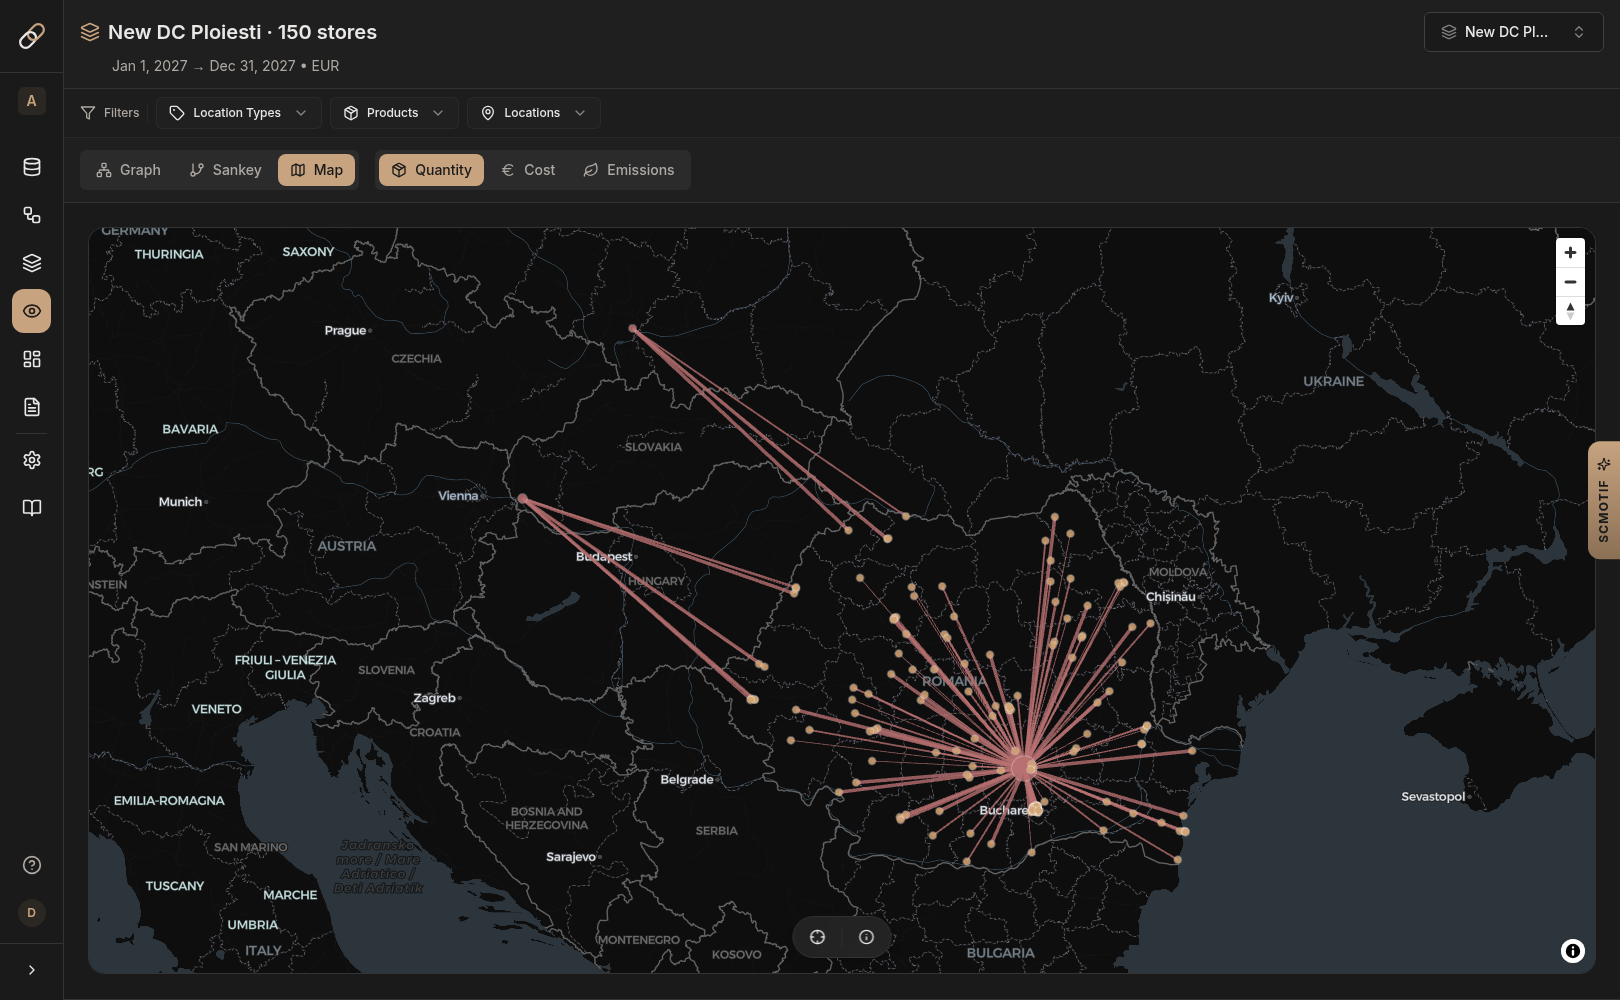
Even with a Romanian DC open, ~9% of volume stays with Bieruń/Bratislava: the north-western stores (the Oradea, Satu Mare, Arad corridor) are simply closer to the existing network, and all of that volume still moves on next-day lanes. A back-of-envelope "one DC serves the whole country" calculation overstates the local DC's cost and understates the network's. The right answer is a split network, and you only see that if the model is allowed to choose per store.
What we deliberately left out
A model is defined by its honest boundaries as much as its results:
- Import strategy. Action consolidates imports centrally through its hub structure for every country. Whether that should change (e.g. containers via Constanța) is a company-level redesign, bigger than one DC decision. The model prices a flat inbound penalty and leaves the port question alone.
- Timing and NPV. The comparison is static by design; the growth-rate-vs-lead-time argument above lives outside the model, where it belongs.
- Cross-docking. A phased cross-dock was in scope originally. We removed it because its real benefits (route density, consolidated multi-drop tours) are outside this model's resolution, and pricing it on linehaul plus double handling alone would have made it lose unfairly.
- Build vs lease. The model prices an owned, full-size DC from day one. A leased or 3PL entry stage, a common first move in new markets, would lower the fixed cost and move break-even earlier without changing the destination. The numbers here are the strategic end-state comparison.
- Store ramp-up curves and Q4 peak sizing are listed with direction-of-bias notes on the assumptions page. (Inventory carrying is not left out. The model prices the incremental stock of a separated pool as a per-pallet adder on the candidate sites. That is part of why the break-even sits at ~56 rather than ~51.)
How this was built
The entire study ran inside SCMotif as one project: the public dataset imported as CSVs, the network expressed as locations, lanes, and policies, every scenario a real optimizer run (40 of them), the break-even chart and service analysis as a live dashboard. Every number traces back to a documented assumption. If you disagree with a number, it's one edit and a re-run away.
Facing a serve-from-afar vs. build-local decision?
SCMotif answers this kind of question with your data instead of public estimates.
Talk to us →Action is a trademark of its owner; it is referenced here solely to identify the publicly reported facts this independent analysis is based on. No affiliation or endorsement is implied.