The product
You ask. Your agent runs the analysis.
SCMotif is a hosted analysis workspace with an MCP server. Your agent in ChatGPT or Claude connects to it, builds workflows and runs analyses. You inspect the data, scenarios and results in your browser.
One analysis, from start to finish
One question leads to the next.
A European wine and spirits network. A quarter of shipment data. The question: which delivery routes reduce costs? This tour follows an executed demo case using example data.
Illustrative conversation, real product captures from the demo project.
01 / The network
In SCMotif
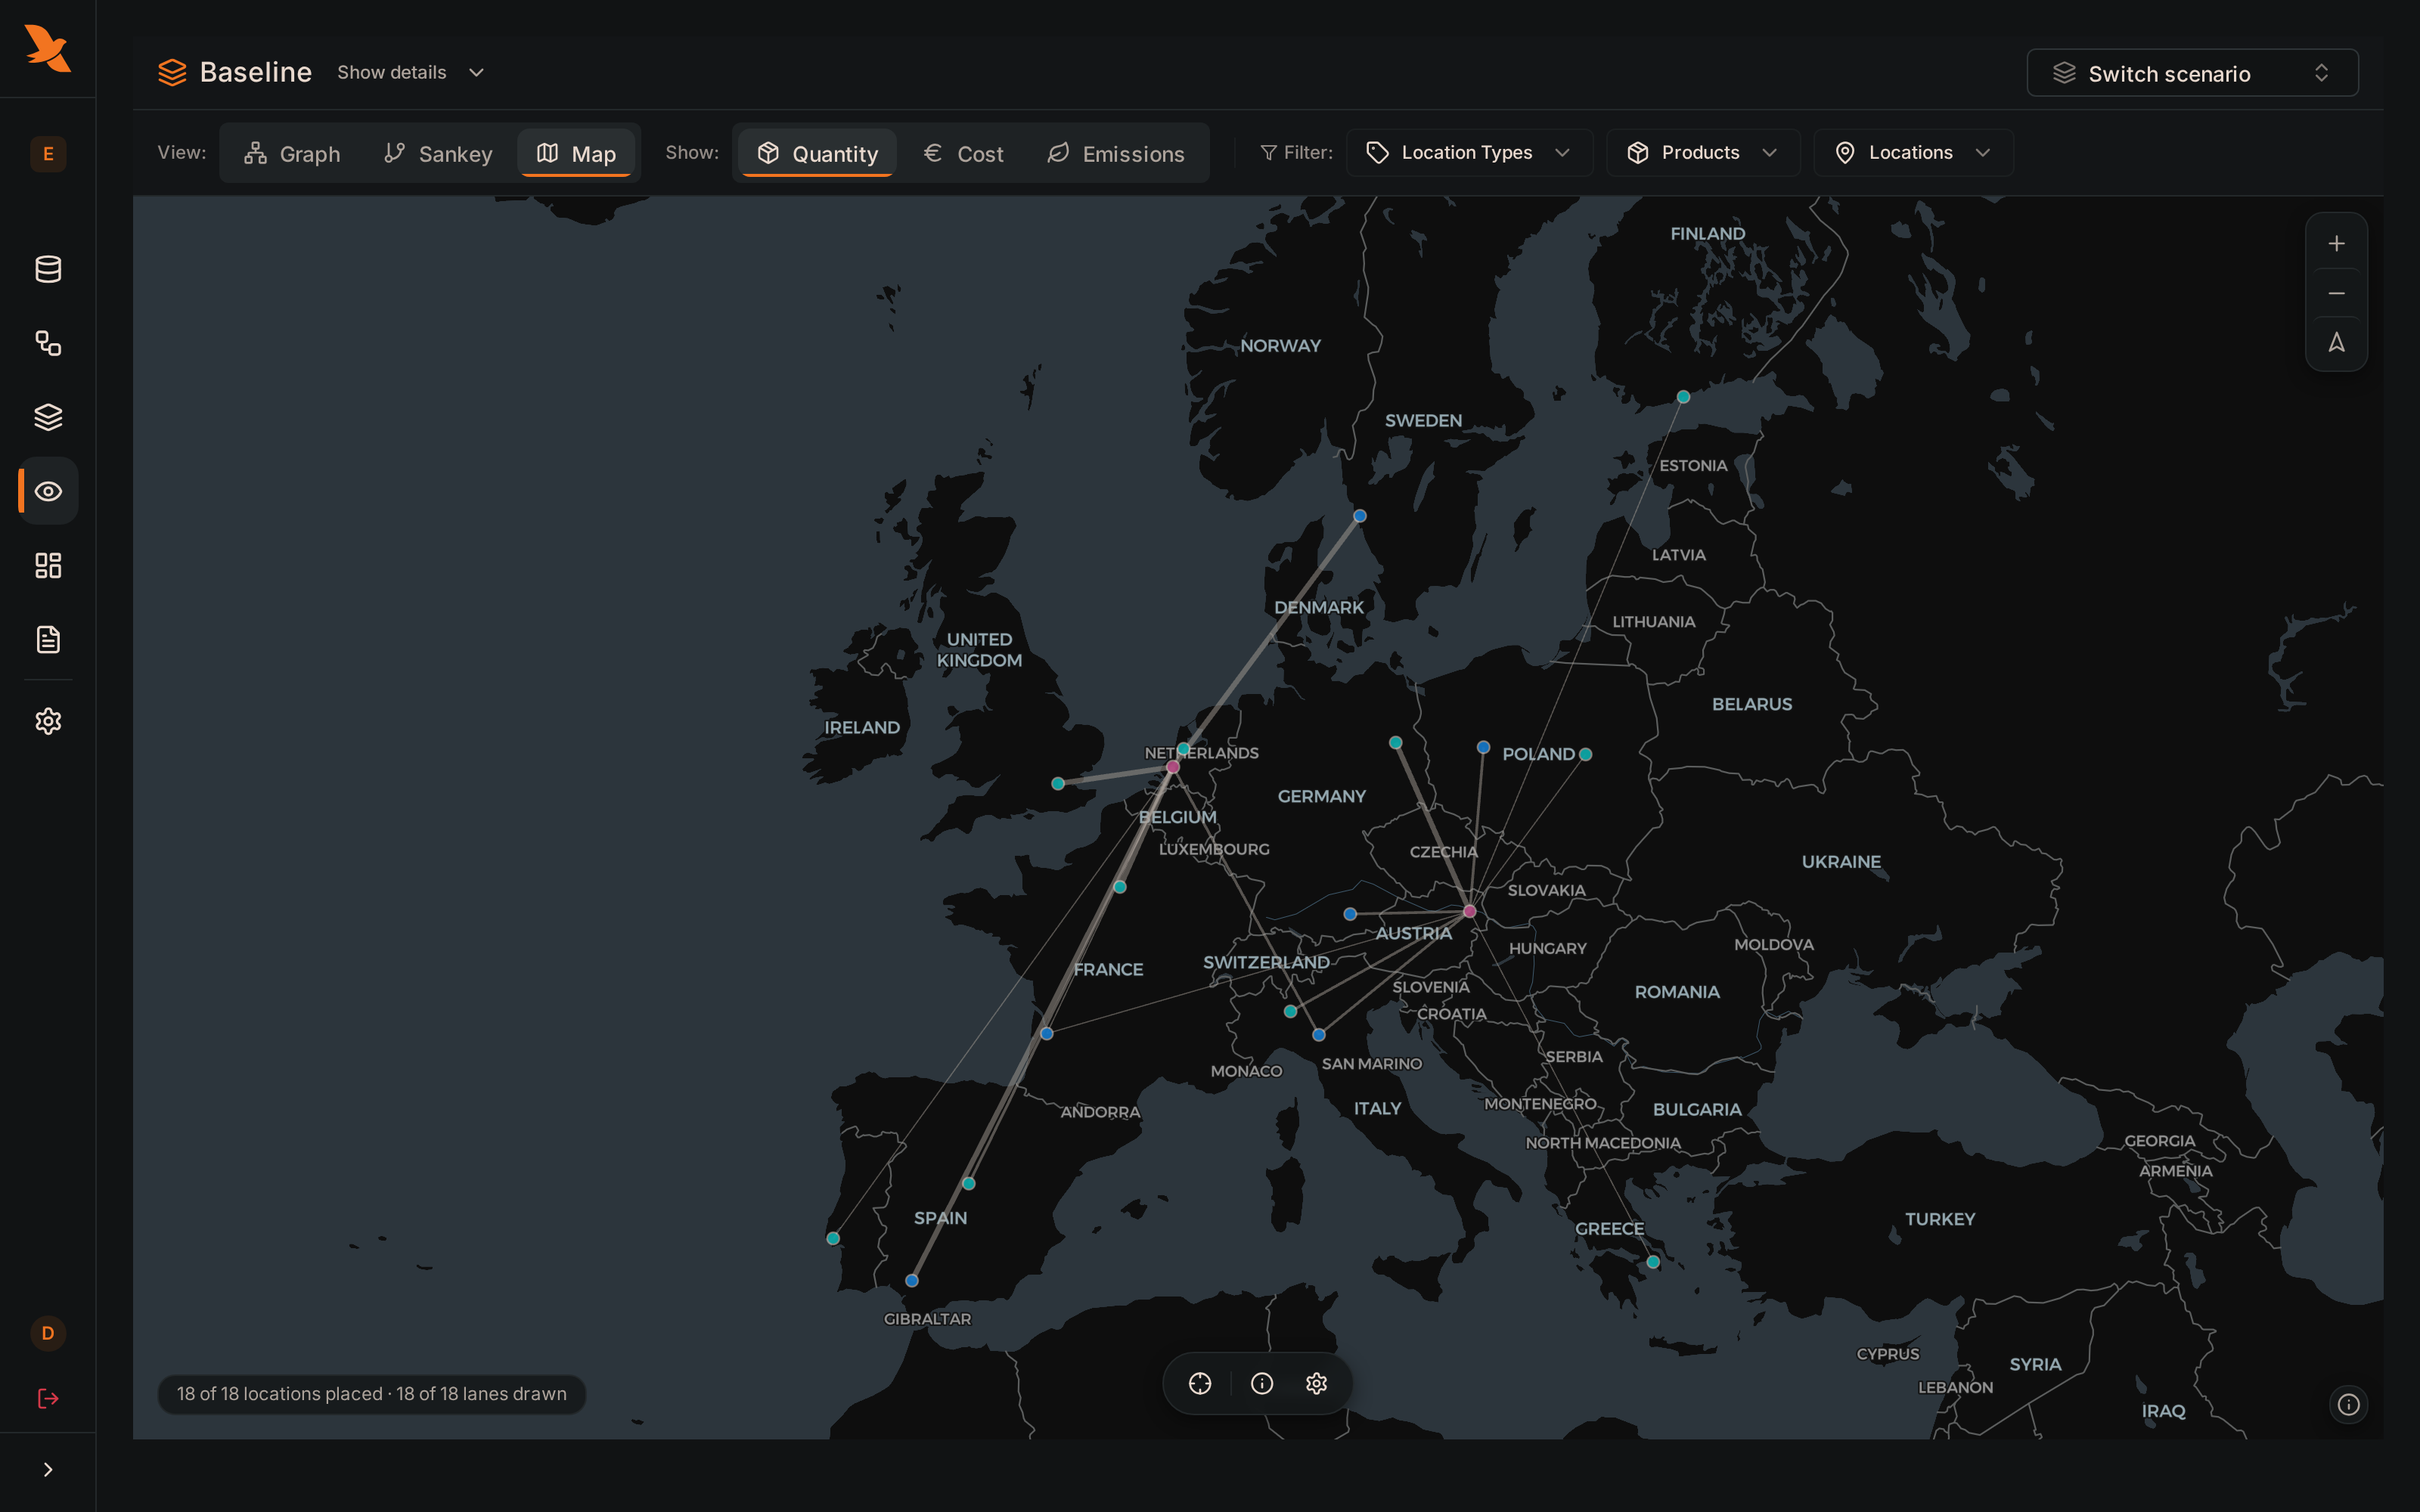
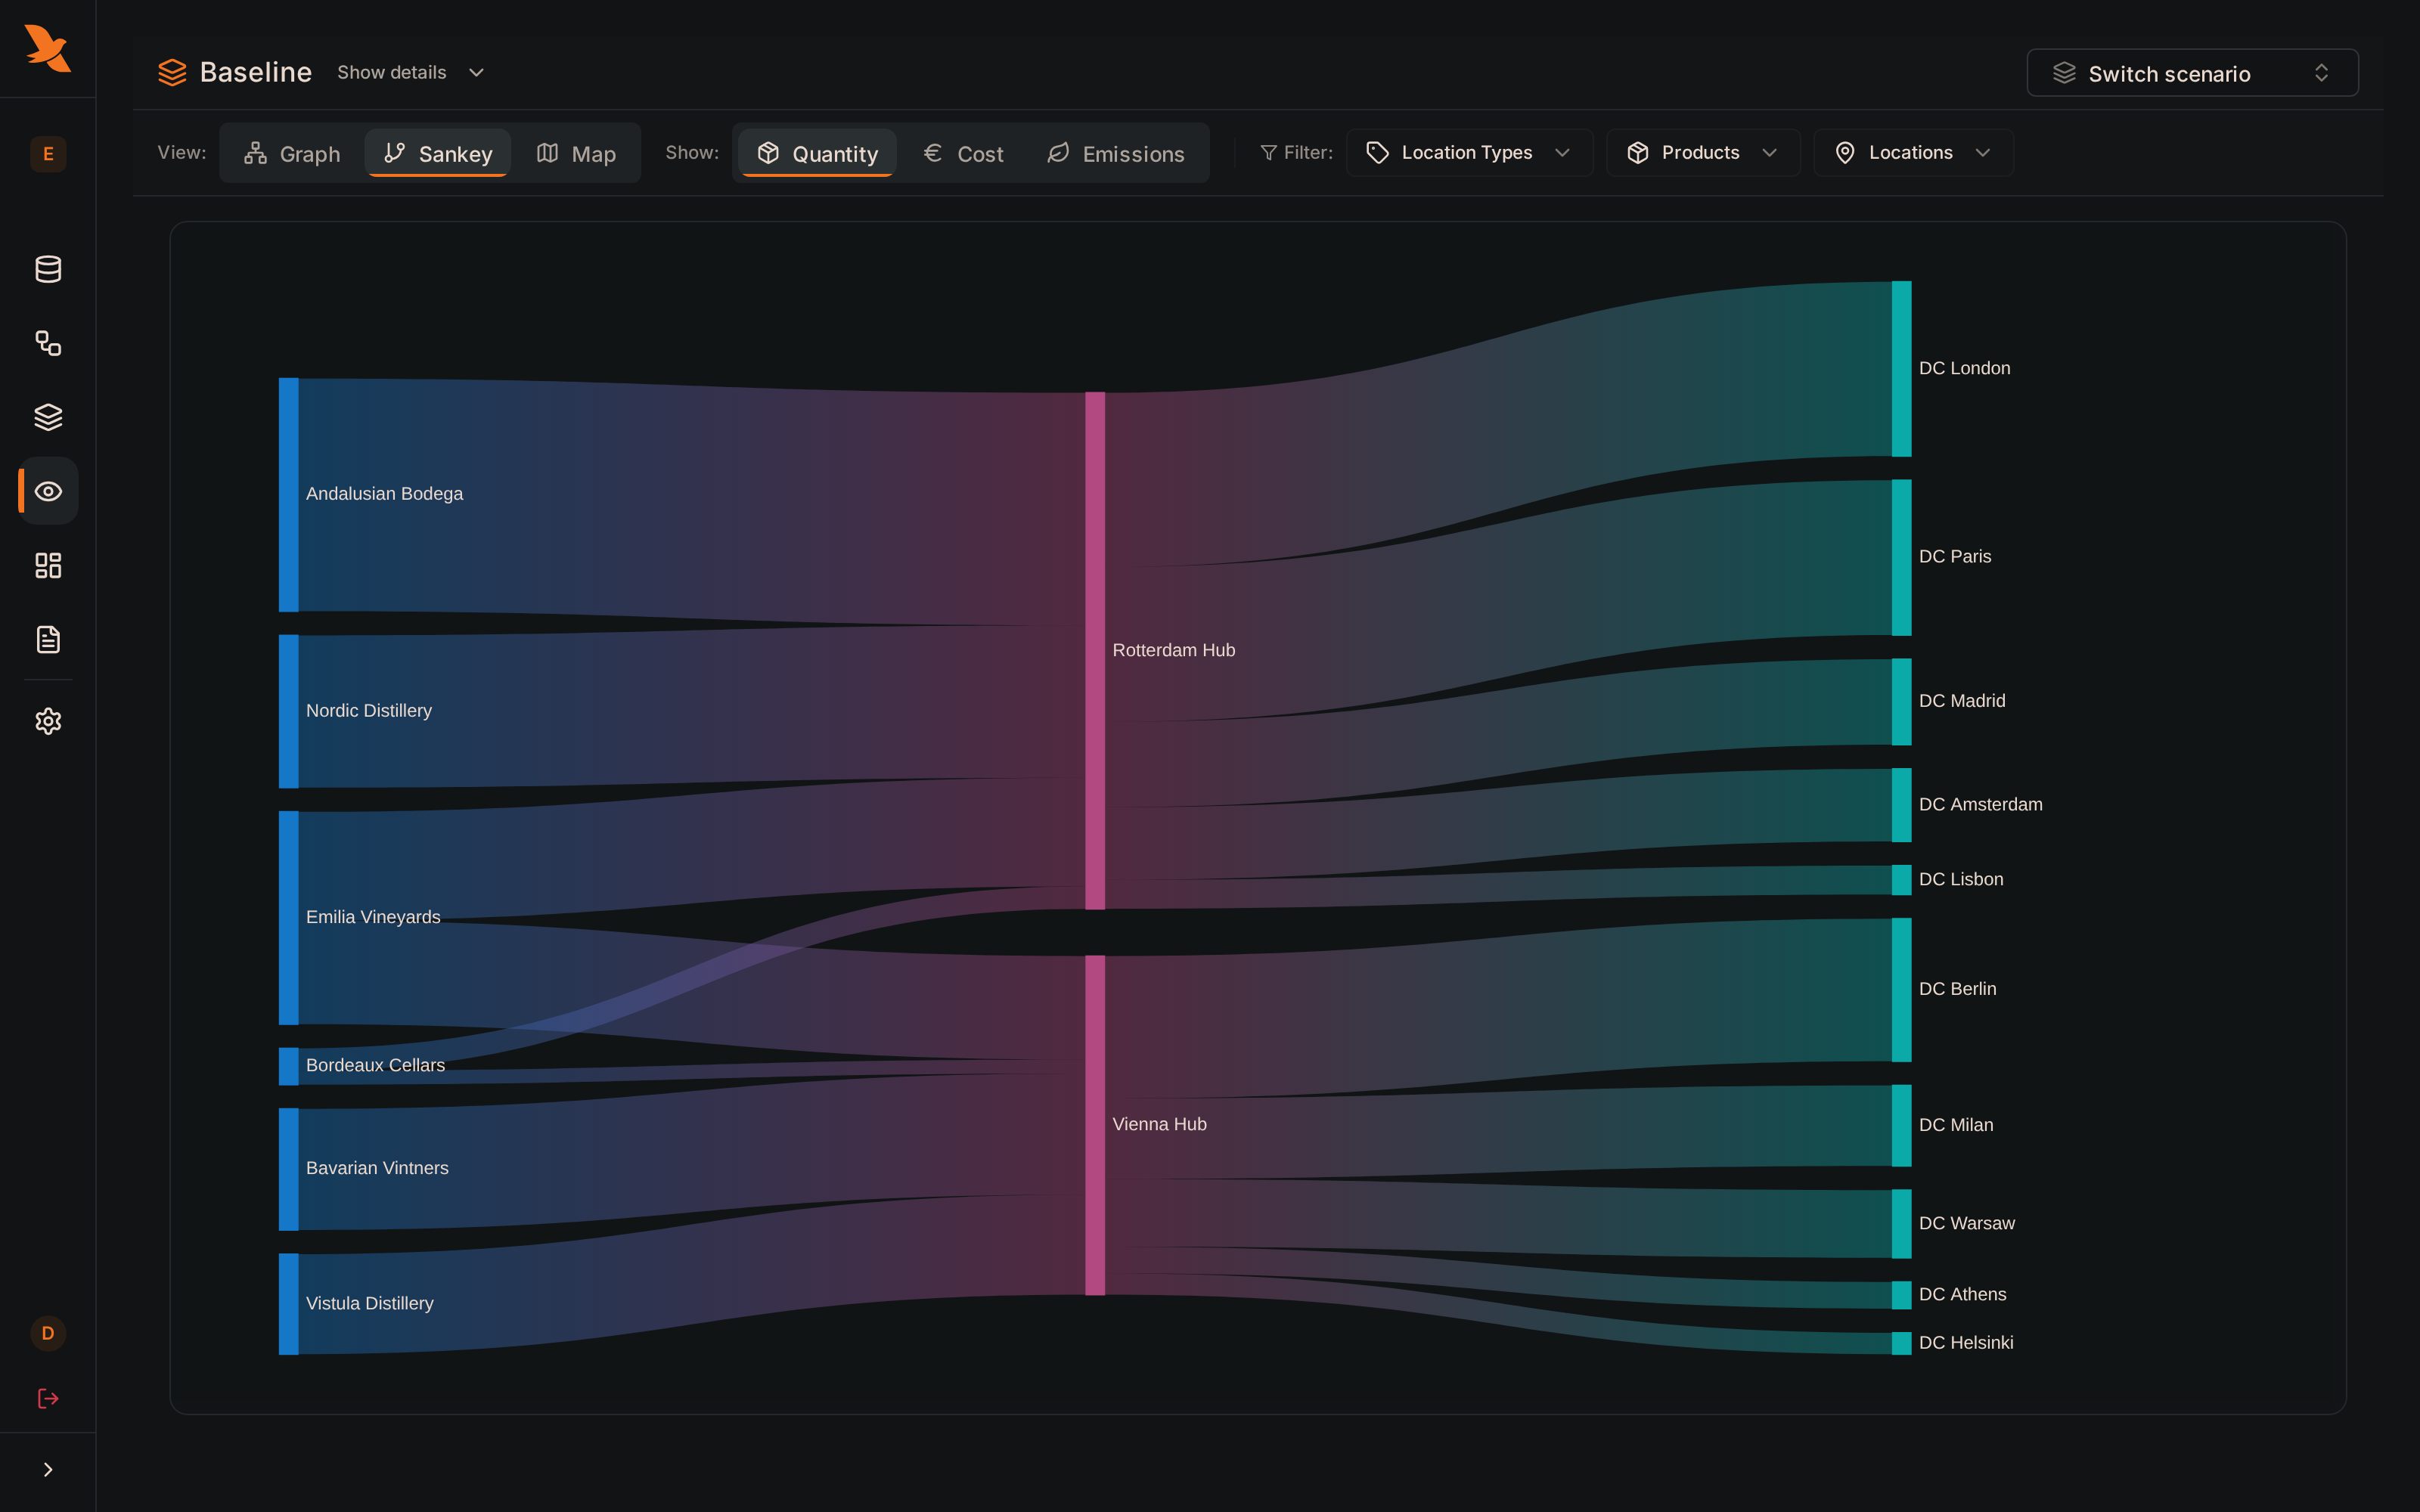
Your agent builds and runs the workflow: from 833 export rows it removes 9 duplicates and 14 cancelled shipments, matches site names and normalizes amounts and units. This produces 72 flows. The baseline scenario holds the network together with its data and assumptions.
Inspect the workflow the agent built
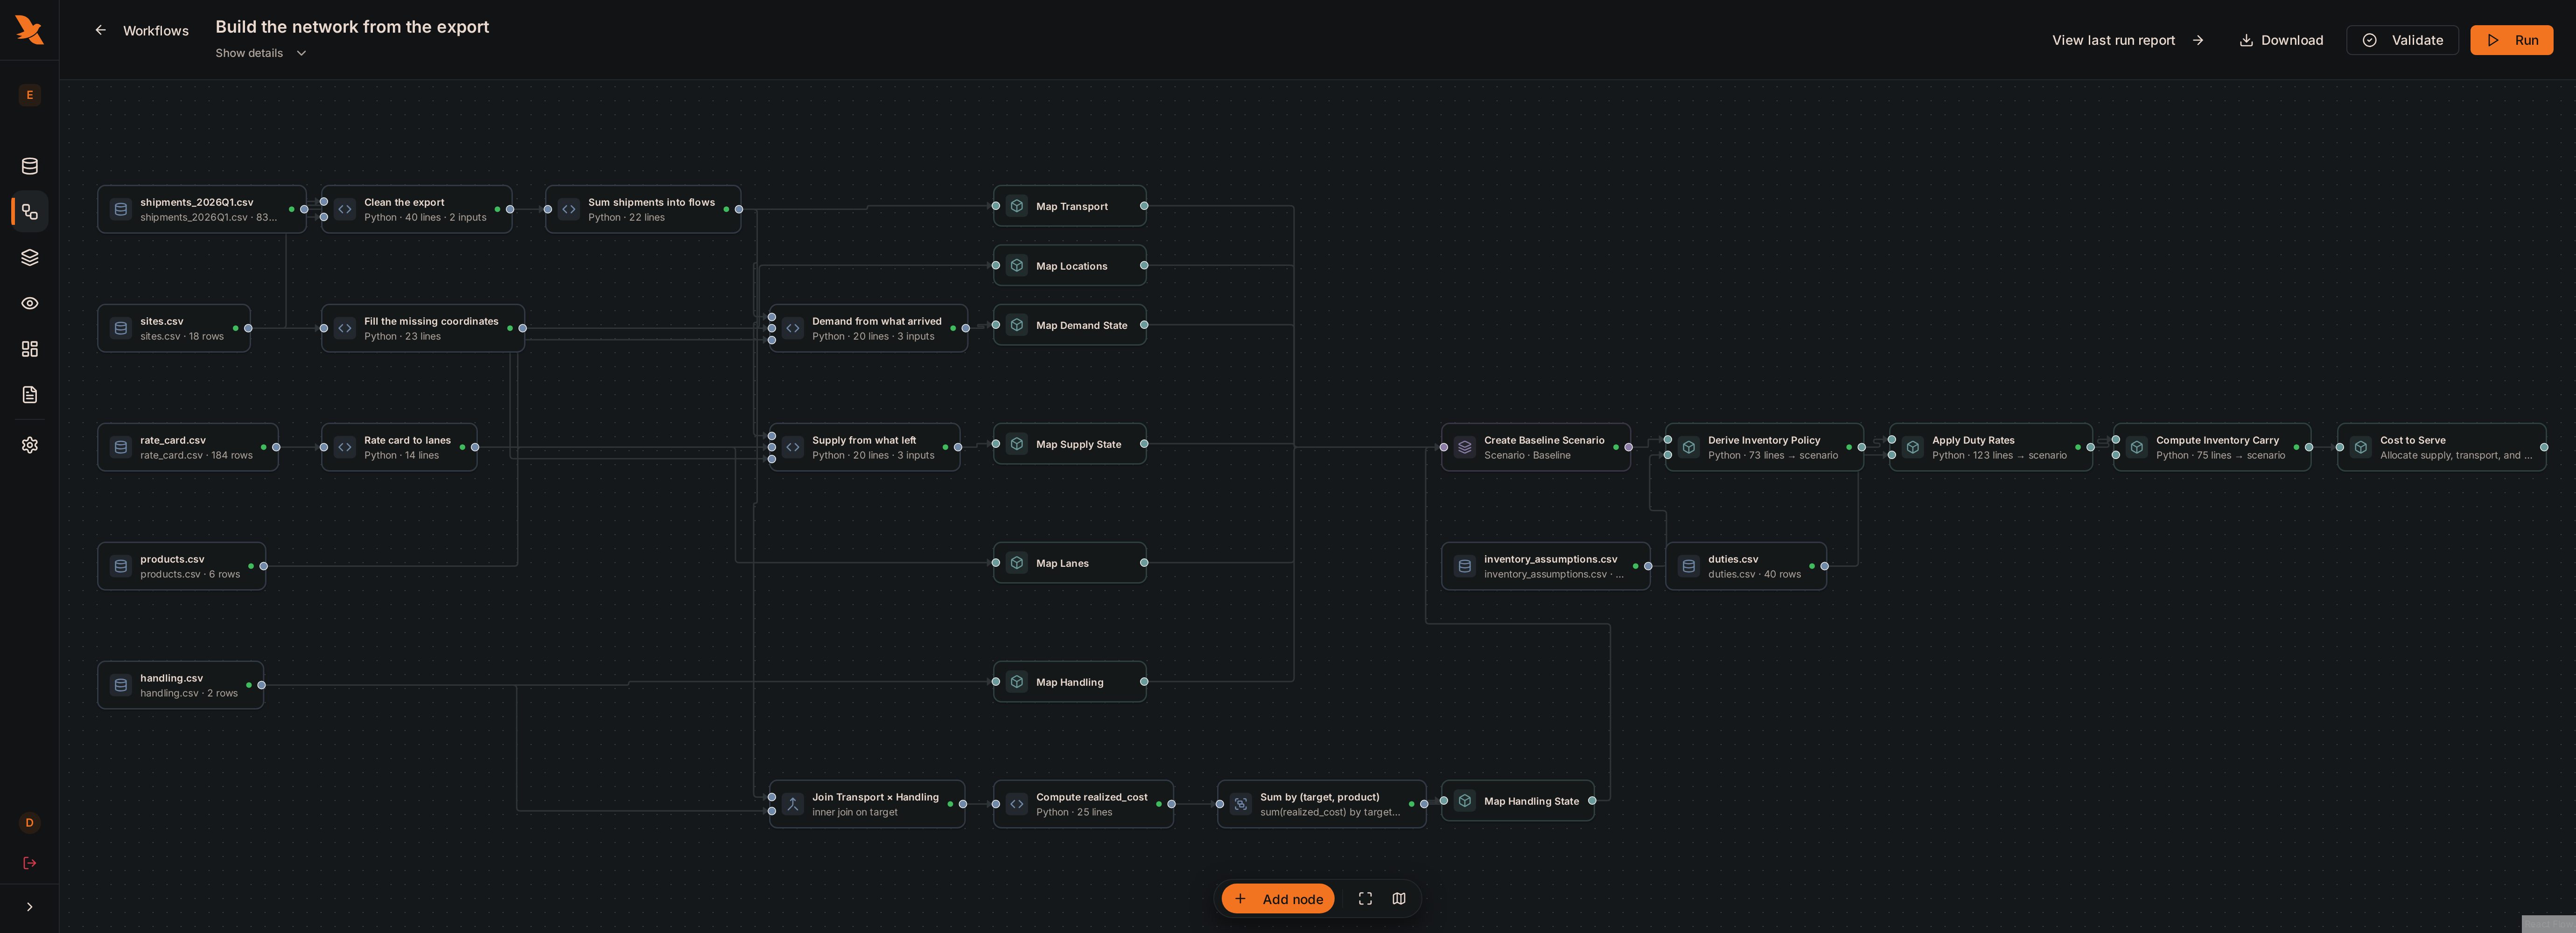
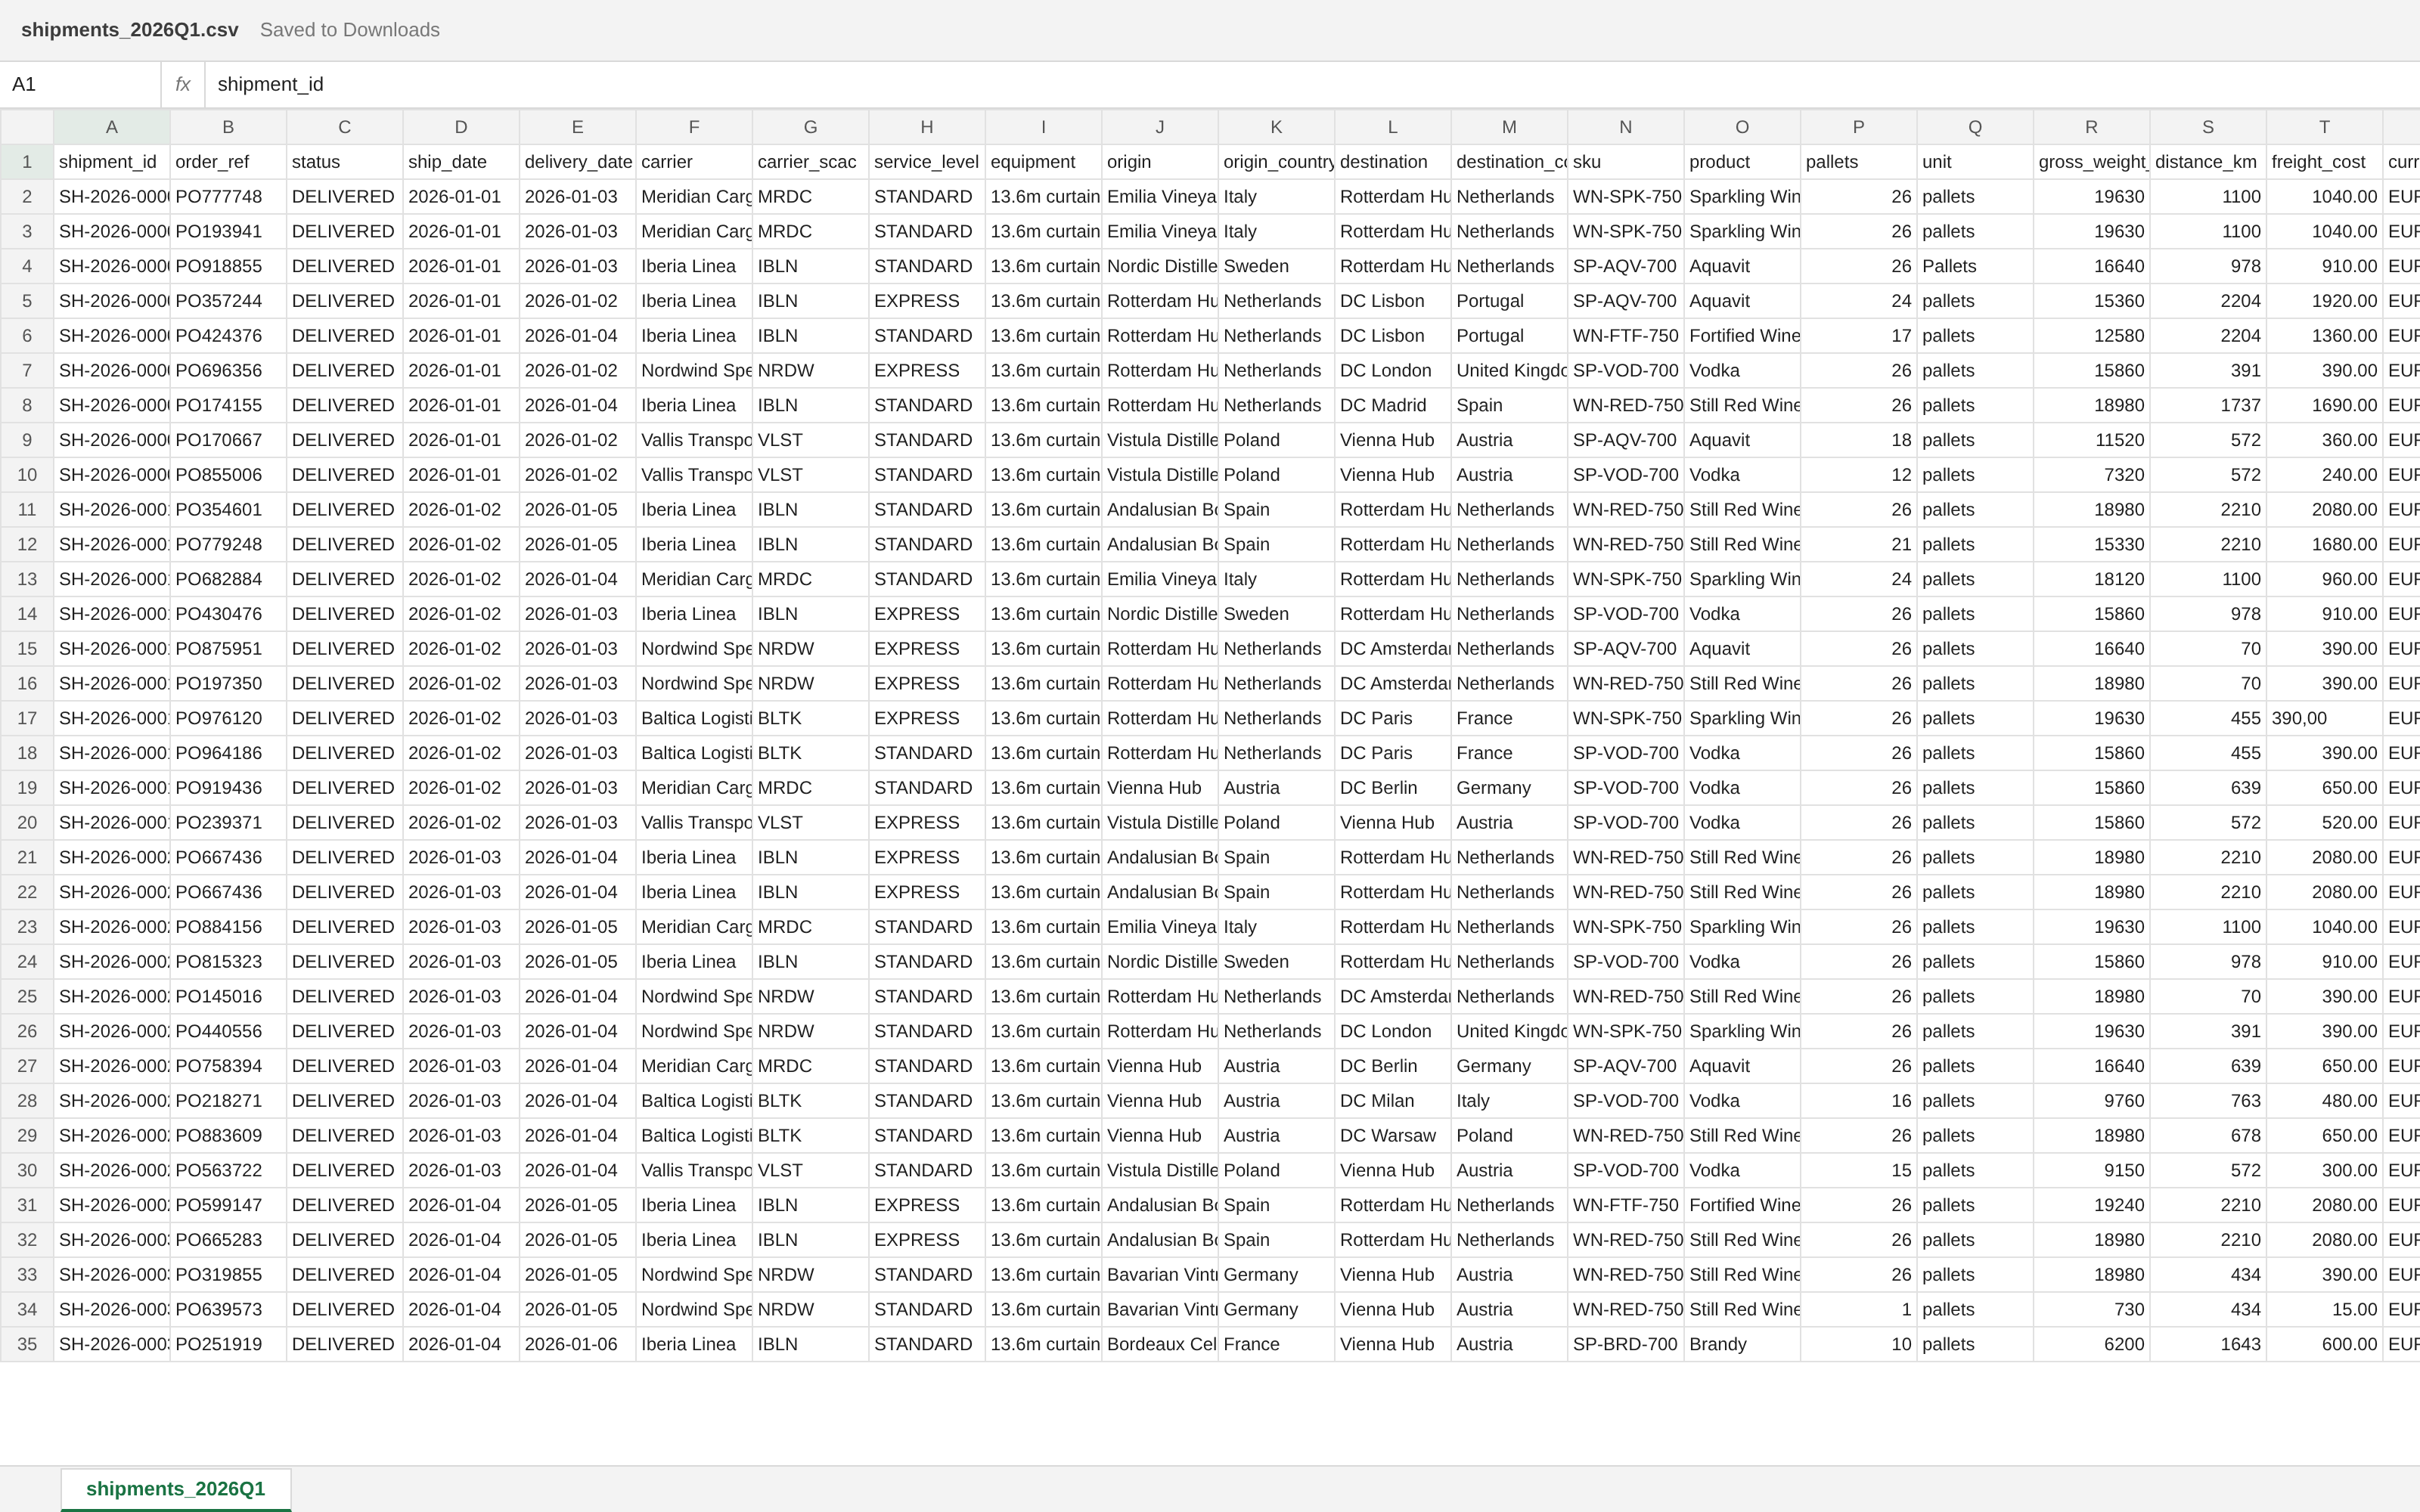
Date errors need to be identified; those date fields are not used to build the flows.
See the flows as a flow diagram
Inspect the original shipment export
02 / The alternative
In SCMotif
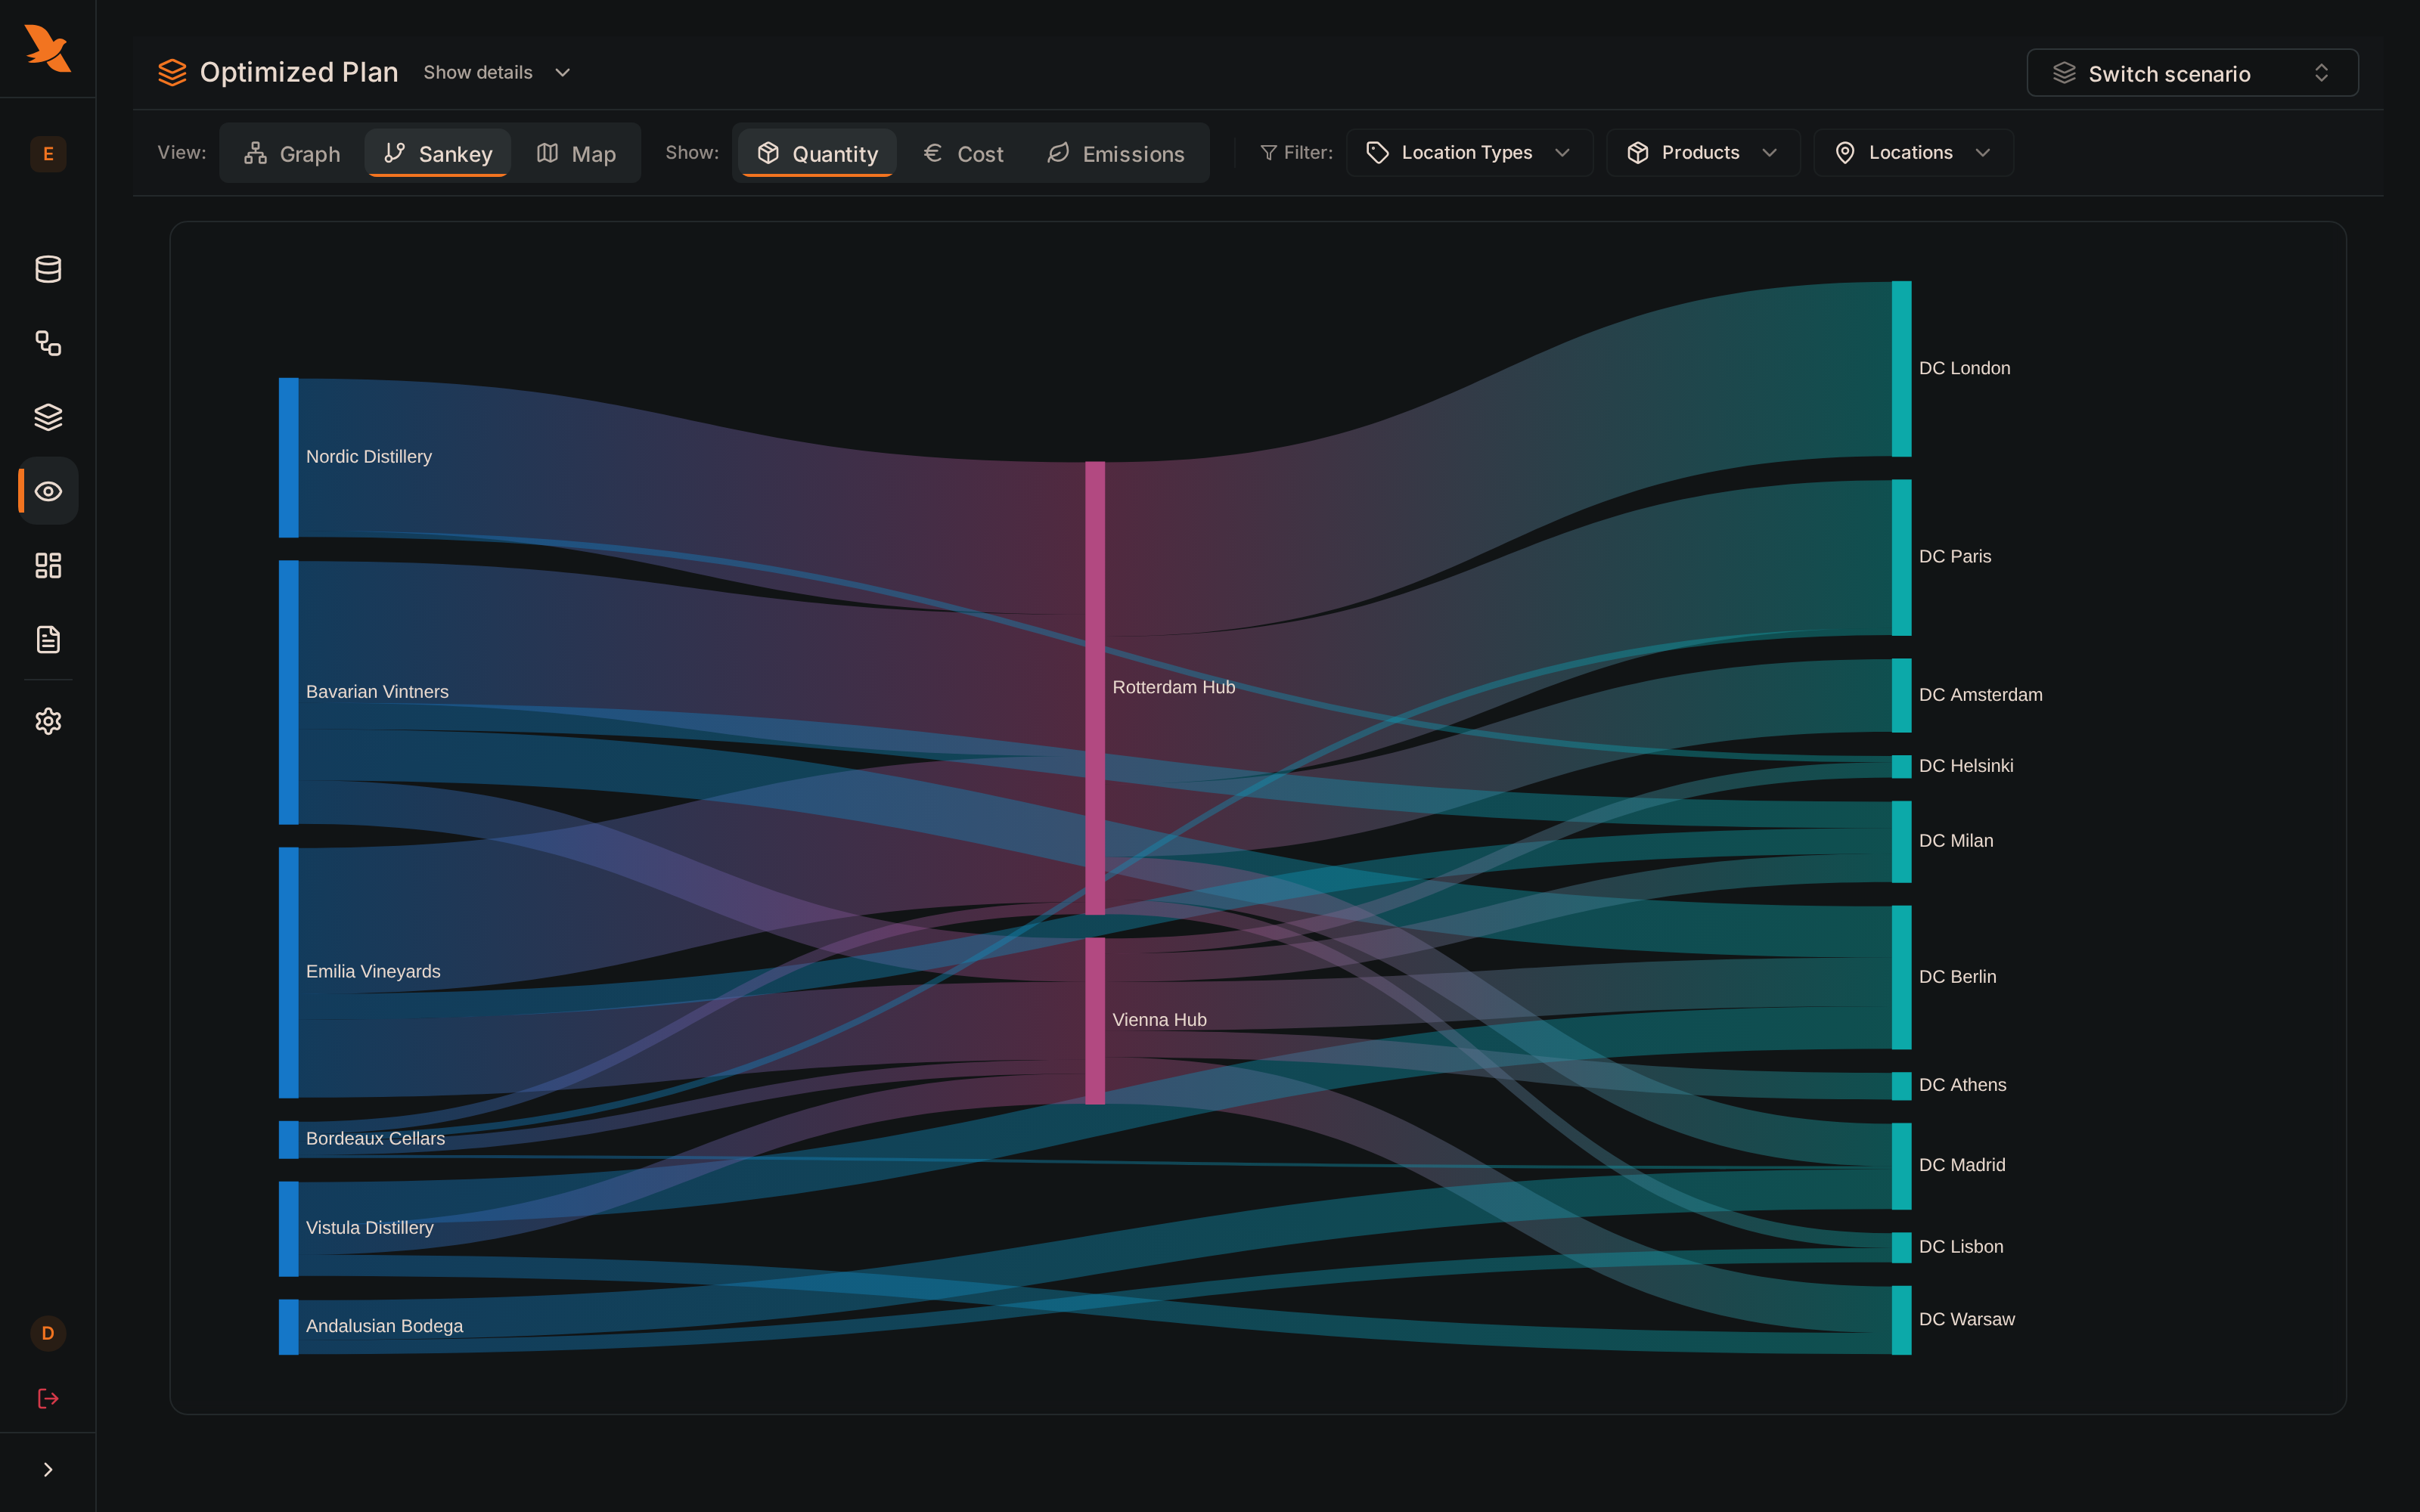
The saving depends on the supplied rates and the calculated premiums for partially filled trucks.
See the optimized plan on the map
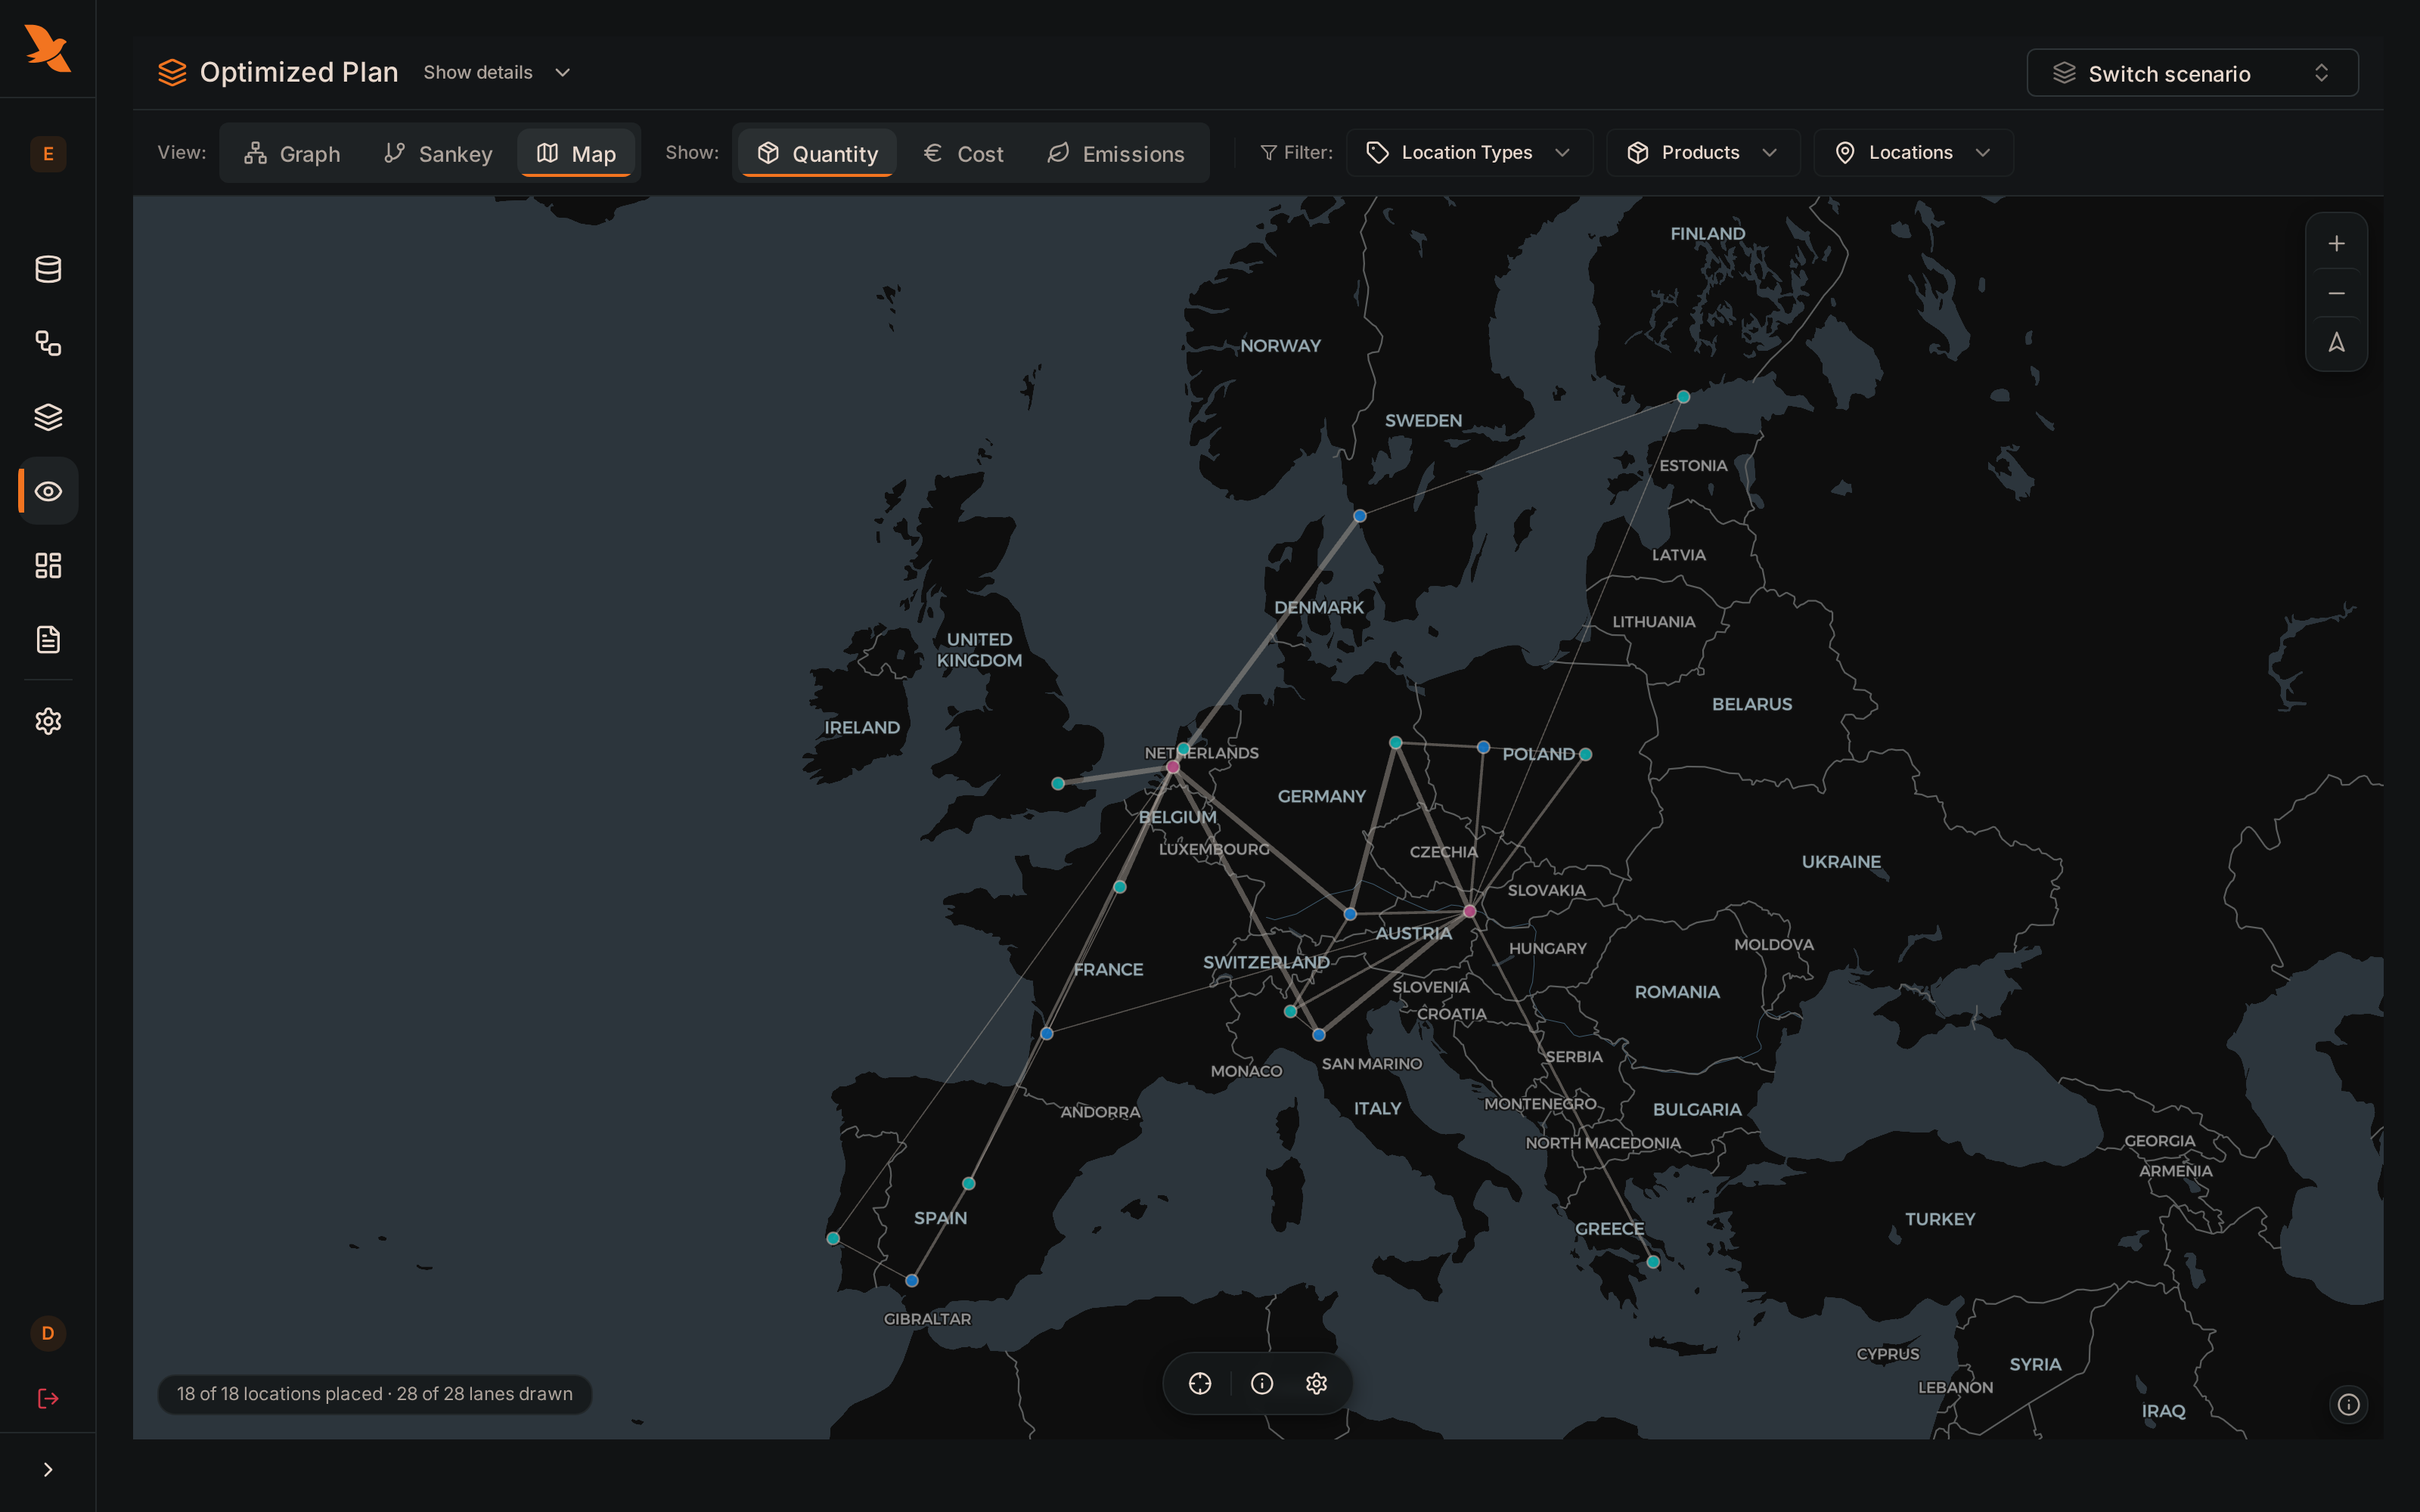
What this comparison assumes
- Comparison basis
- The baseline uses flows and freight costs from the cleaned shipments. The optimized plan uses the rate card. Both cover the same quarter and delivered quantities.
- Routes and truck utilization
- The supplied rates already include direct routes. The workflow keeps the full-truck rate and calculates higher per-pallet rates for 80% and 60% fills: base rate × 0.95 ÷ fill fraction. Existing LTL rates stay unchanged. Inventory assumptions set replenishment frequency and therefore which fill levels are feasible.
- Capacity and costs
- Supplier capacity is unconstrained. Hub handling and financing of duty-paid inventory use the supplied assumptions. Site fixed costs are outside this comparison.
- What this run establishes
- This run does not show sensitivity to different rates or inventory assumptions. It is a first model comparison; changed assumptions need another run.
03 / The explanation
In SCMotif
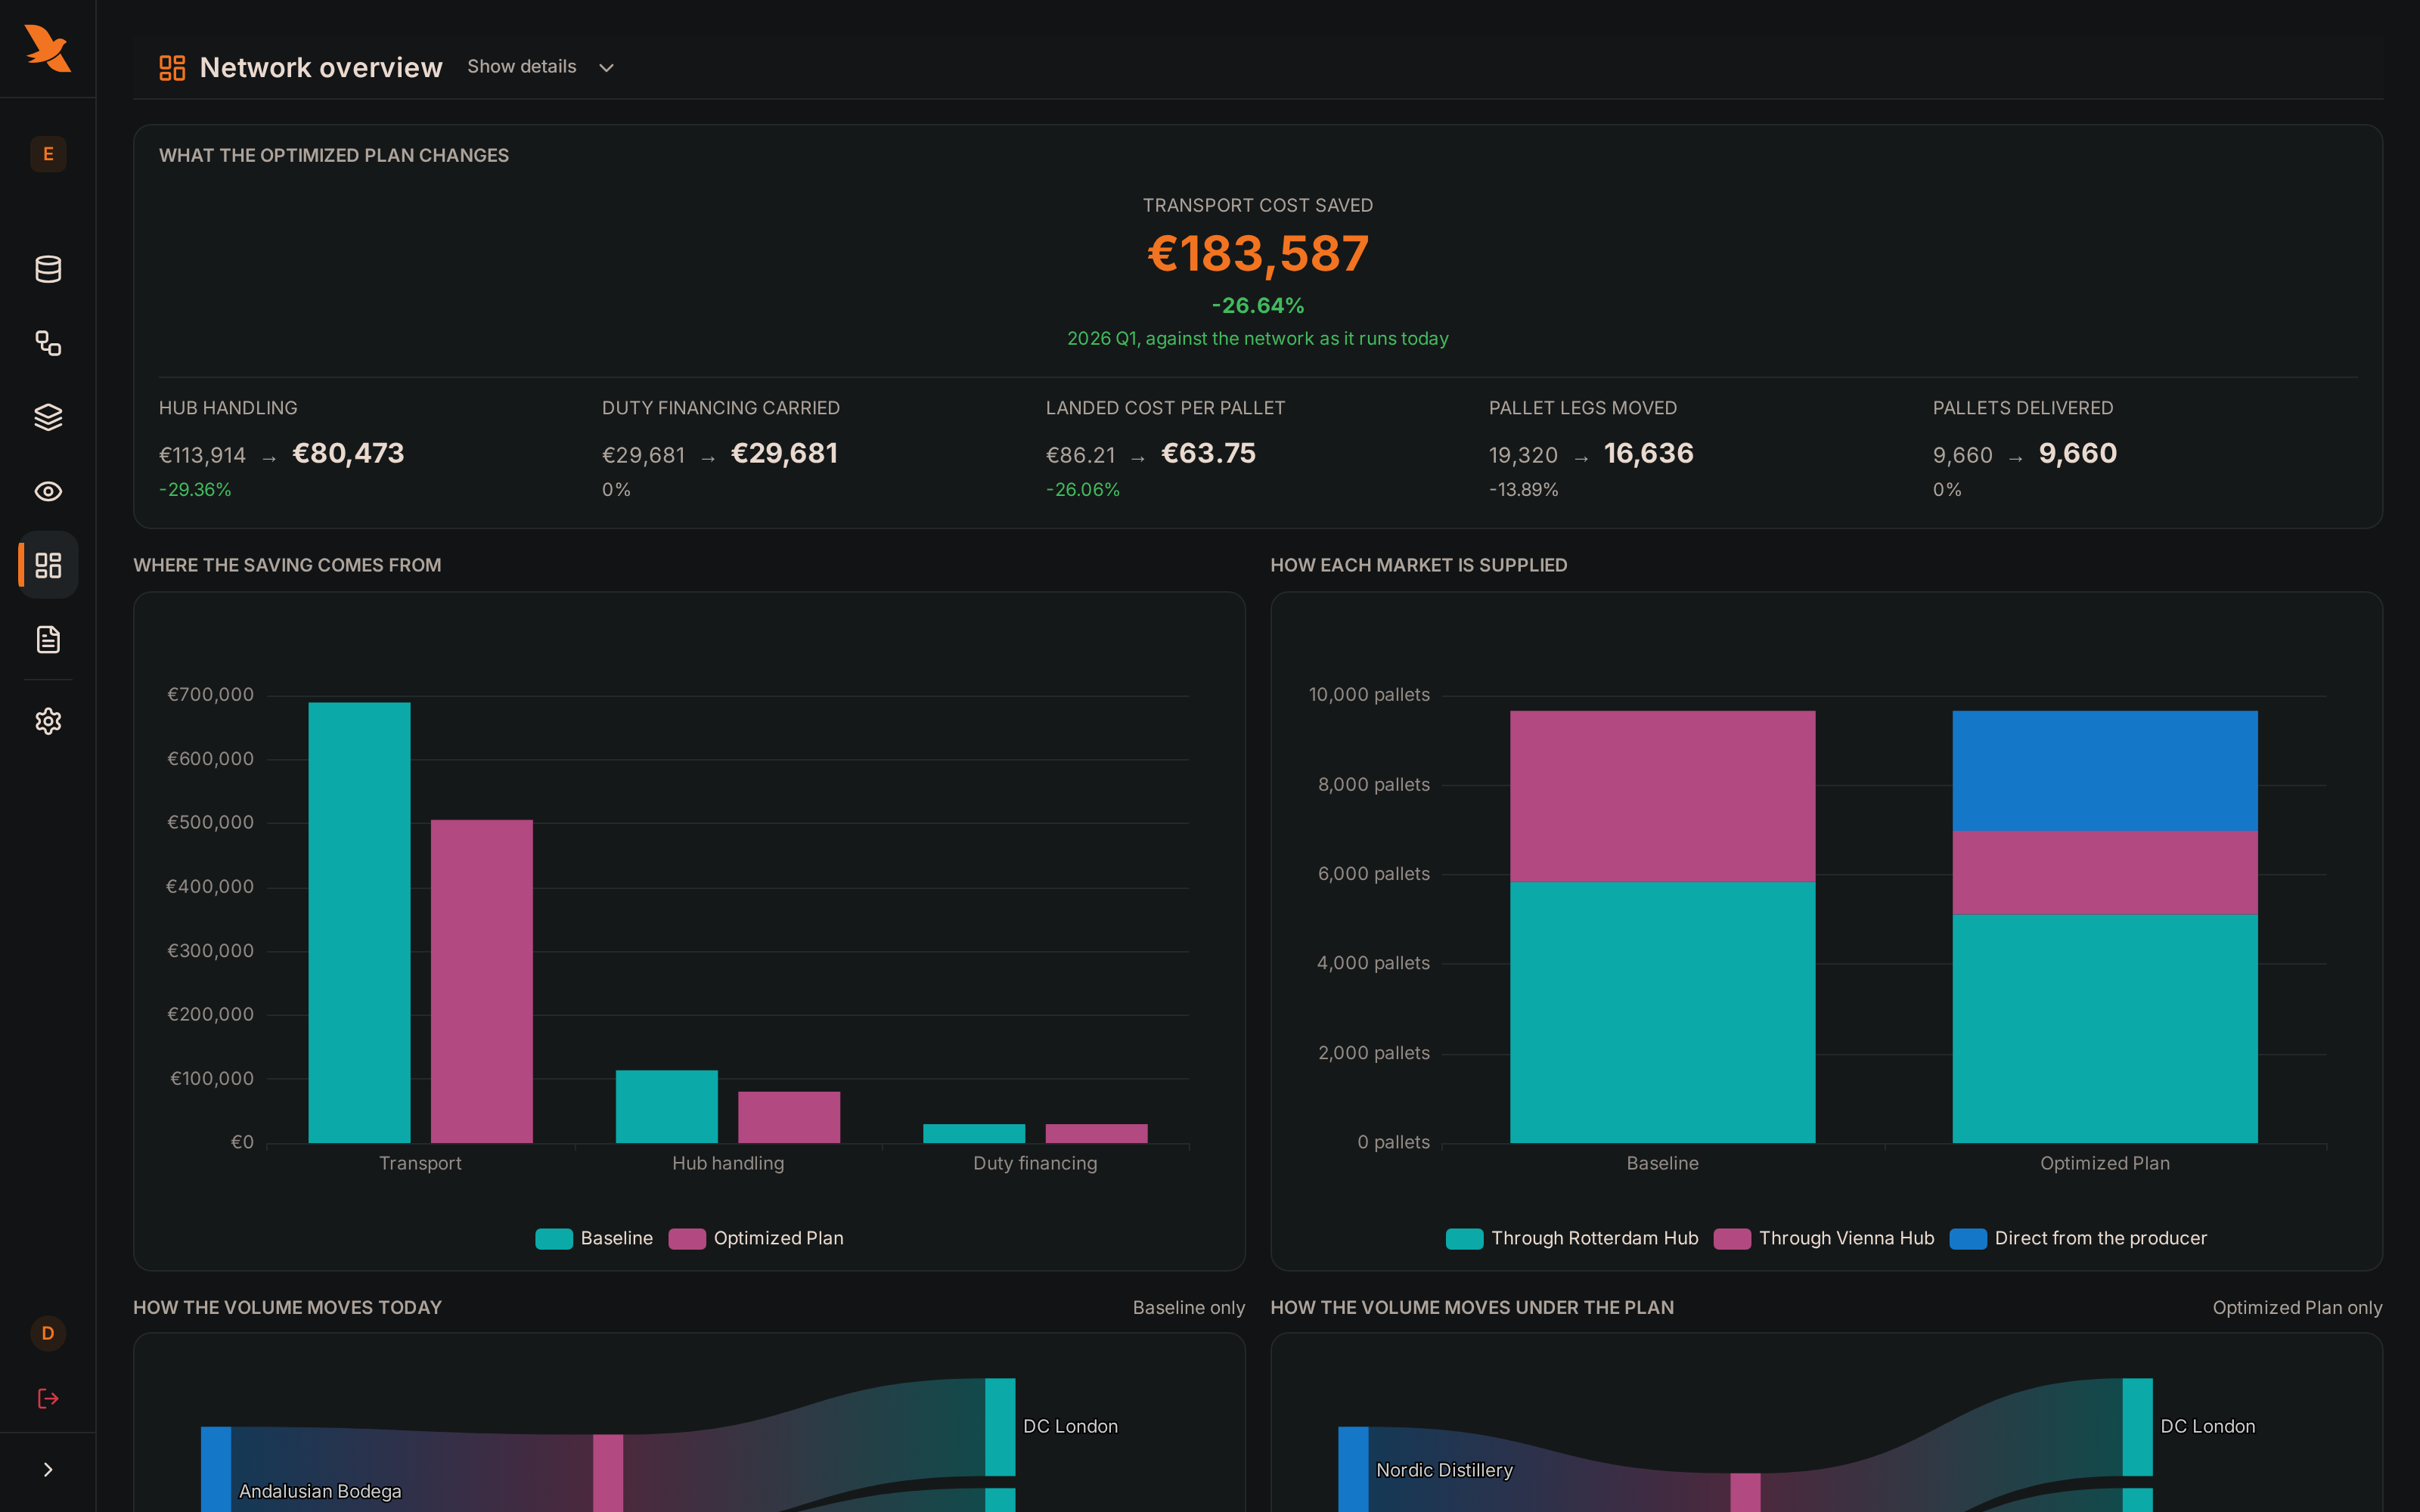
The savings shown belong to this demo case and its assumptions. Your network needs an analysis using your own data.
Trace one result
Example: still red wine from Bavarian Vintners to Berlin, delivered directly by truck.
- Rate card input
- €50 per pallet on the Bavarian Vintners → DC Berlin FTL lane.
- Volume in the optimized result
- 580 pallets on this lane for the quarter.
- Transport cost on this lane
- 580 × €50 = €29,000. This amount appears in the optimized flow.
This checks one lane’s transport cost; it does not attribute the entire saving to that lane.
Tools for your next question
The workflow follows your question. These analyses are available alongside the example above.
- Flow maps
- See where the volume actually goes.
- Center of gravity
- Where a site should sit, given the flows.
- XYZ segmentation
- Sorts items by how steady their demand is, before anything is planned around them.
- What-if scenarios
- Build several and compare them side by side.
- Network optimization
- Solves a mixed-integer model instead of guessing the answer.
Fit & limits
Does SCMotif fit your analysis?
- What can I bring in?
- Tabular data as CSV or Excel (XLSX, XLS). The fields you need depend on the question: a map needs different inputs from a cost optimization.
- What are the size limits?
- The default configuration allows up to 1 GiB per file and 1,000,000 data rows per parsed table. XLSX also has a 200 MiB uncompressed limit and a maximum compression ratio of 100:1. The default storage budget is 5 GiB per account, including computed data. Your workspace configuration may differ.
- How large can an optimization model be?
- The file limit is not a promise about solvable network size. Runtime and memory depend on products, routes and constraints. No universal maximum site count is promised here; we assess the fit using your analysis during the beta.
- What remains after a run?
- The saved workflow, generated scenarios and a dashboard in the workspace. You can inspect results as tables and visualizations, and run the workflow again.
- How do I get access?
- Access to the hosted workspace and MCP server is through the private beta. Bring a concrete analysis and the data it needs.
Bring a question from your own work.
The private beta starts with a concrete analysis you need to deliver.
Explore beta access →